
How to Make 2D Protein-Ligand Interaction Diagrams (LigPlot+ & PLIP): Step by Step
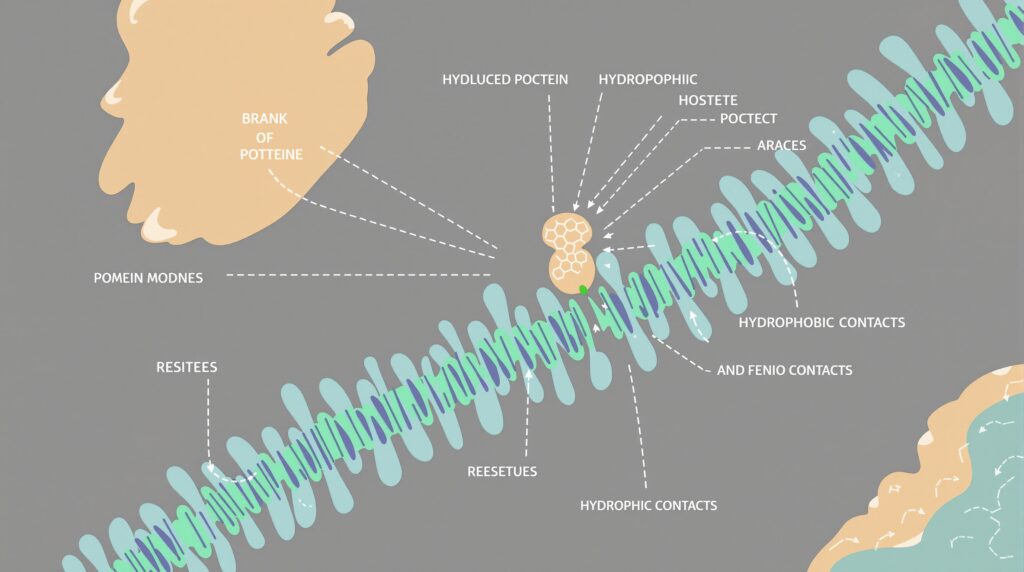
To turn a docking pose into a 2D interaction diagram, merge the receptor and the docked ligand into one PDB file, then open it in LigPlot+ to draw hydrogen bonds and hydrophobic contacts as a flat, labelled schematic. Use the PLIP web server to confirm every interaction type with measured distances before you put the figure in a report.
You have run a docking job in AutoDock Vina or PyRx and you have a pose that scores well. A binding affinity number alone will not convince a thesis examiner. What they want to see is which residues hold the ligand in place and how. That is exactly what a 2D protein-ligand interaction diagram shows, and it is one of the most reused figures in any docking chapter. This guide, from the StemSkills Lab team (10+ years in structural bioinformatics and drug design), walks through the free workflow end to end.
Why do you need a 2D protein-ligand interaction diagram?
A docking score is a single number. A 2D diagram is the evidence behind it. It flattens the 3D binding pocket into a schematic that names every interacting residue and marks each hydrogen bond with its distance and each hydrophobic contact as an arc. Reviewers, supervisors, and grant panels read these diagrams in seconds, which is why nearly every docking paper includes one.
The diagram answers the question a good examiner always asks: is the binding chemically reasonable, or did the scoring function reward a pose that makes no sense? If your ligand forms two hydrogen bonds to a catalytic residue and packs against known hydrophobic pocket residues, you have a defensible result. If it floats with no contacts, the diagram exposes it. As the original LIGPLOT paper framed the task, the aim is to “generate schematic diagrams of protein-ligand interactions” (Wallace, Laskowski and Thornton, 1995).
What is the difference between LigPlot+ and PLIP?
They solve two halves of the same problem. LigPlot+ draws the flat 2D figure you paste into a report. PLIP (the Protein-Ligand Interaction Profiler) automatically detects and quantifies every interaction and hands you a 3D view plus a full table, which is the fastest way to check that your diagram is complete. Most students use PLIP to find and measure the interactions and LigPlot+ to draw them.
| Feature | LigPlot+ | PLIP (web / CLI) | Discovery Studio Visualizer |
|---|---|---|---|
| Main output | 2D schematic diagram | Interaction table + 3D PyMOL view | 2D and 3D diagrams |
| Runs where | Desktop app (Java, Win/Mac/Linux) | Web server or command line | Desktop app (Win/Linux) |
| Install needed | Yes (free academic download) | No (web) / pip or Docker (CLI) | Yes (free registration) |
| Interaction types | H-bonds, hydrophobic contacts | 7 non-covalent types + metal complexes | Most non-covalent types |
| Best for | The publication figure | Complete, measured interaction list | An all-in-one free alternative |
| Cost | Free (academic) | Free and open source | Free |
PLIP is open source and, in its original release, was built to detect “seven types of non-covalent interactions” (Salentin et al., 2015), including hydrogen bonds, hydrophobic contacts, pi-stacking, pi-cation interactions, salt bridges, water bridges, and halogen bonds. That breadth is why it is worth running even when LigPlot+ will produce your final figure. For the upstream steps that feed this analysis, see our molecular docking pillar guide.
How do you prepare a docking pose for interaction analysis?
Both tools need a single PDB file that contains the protein and the ligand together, with the ligand written as HETATM records. AutoDock Vina and PyRx give you PDBQT output, and Vina packs several poses into one file, so there are two jobs: pull out the best pose and convert it to PDB.
- Split the poses. Vina numbers models best-first. Extract model 1 with Open Babel:
obabel ligand_out.pdbqt -O pose1.pdb -f 1 -l 1 - Keep the receptor as PDB. If your receptor is still a PDBQT, convert it back:
obabel receptor.pdbqt -O receptor.pdb. Better, reuse the clean PDB you prepared before docking. - Merge into one complex. Combine the receptor and the ligand pose into a single file. In PyMOL: load both, then
save complex.pdb. Confirm the ligand lines start with HETATM and share a residue name (Open Babel usually writes UNL).
Getting hydrogens and protonation right upstream matters here, because a missing polar hydrogen makes a real hydrogen bond disappear from the diagram. If you skipped that, revisit structure preparation before you draw anything.
Want the guided, hands-on version?
Our live Molecular Modeling & MD Simulations cohort bootcamp takes you from zero to running real docking and MD workflows, with a portfolio project for your grad-school applications.
How do you make a 2D diagram in LigPlot+?
LigPlot+ is a free download for academic use from the EMBL-EBI Thornton group (LigPlus software page). It bundles the plotting engine with HBPLUS, which calculates the hydrogen bonds. It runs anywhere Java runs.
- Open the complex. Launch LigPlot+ and open your merged
complex.pdb. - Pick the ligand. LigPlot+ lists the HETATM groups it finds. Select your ligand residue (for example UNL) as the target for the plot.
- Generate the diagram. The program runs HBPLUS and draws the ligand in the centre. Hydrogen bonds appear as green dashed lines labelled with their length in angstroms, and hydrophobic contacts appear as red arcs (the “eyelashes”) pointing at the residues that make them.
- Tidy and export. Drag labels so nothing overlaps, then export the figure as PostScript, PNG, or PDF for your report.
The result is the classic ligand-in-a-web schematic that a structural biologist recognises immediately.
How do you profile interactions with the PLIP web server?
PLIP is the fastest way to get a complete, measured interaction list, and it needs no install.
- Go to the PLIP web server at plip-tool.biotec.tu-dresden.de (TU Dresden).
- Provide your structure. Enter a four-character PDB ID for a known complex, or upload your own
complex.pdbfrom docking. - Run and read the report. PLIP detects the ligand automatically and returns a table for each interaction type: the residue, the atoms involved, and the measured distance and angle. It also gives you a ready-made 3D view and a downloadable PyMOL session.
Prefer the command line? Install PLIP with pip install plip (it uses Open Babel and PyMOL) and run plip -f complex.pdb -t -y to get a text report (-t) and a PyMOL image (-y). Cross-check the PLIP table against your LigPlot+ figure: if PLIP reports a salt bridge or pi-stacking that LigPlot+ does not draw, add that detail to your figure caption so nothing important is lost.
How do you read a LigPlot+ interaction diagram?
Three visual codes carry almost all the meaning. Green dashed lines are hydrogen bonds, and the number on each line is the donor-acceptor distance in angstroms (typical hydrogen bonds fall around 2.7 to 3.3 A). Red arcs with radiating spokes are hydrophobic contacts, and the residue they point to is the one packing against the ligand. Every contacting residue is labelled with its three-letter code, sequence number, and chain, for example His41(A).
When you write the caption, state the receptor and ligand, the docking program, and that interactions were detected with LigPlot+ and PLIP. That single sentence makes the figure reproducible. To see where interaction analysis sits in the full path from sequence to simulation, follow our computational biology skills roadmap.
Troubleshooting: common LigPlot+ and PLIP errors
- “No ligand found” or the ligand is missing. The ligand atoms are probably written as ATOM instead of HETATM, or the file only contains the protein. Open the PDB in a text editor, confirm the ligand lines begin with HETATM, and make sure you merged receptor and pose into one file.
- Zero hydrogen bonds on an obviously bound ligand. Your structure has no polar hydrogens. PLIP adds hydrogens internally, but LigPlot+ relies on HBPLUS geometry, so add hydrogens (for example with Open Babel
-p 7.4or in your preparation step) before plotting. - Garbled atom names after PDBQT conversion. PDBQT stores Gasteiger charges and merged non-polar hydrogens, which can confuse plotting. Convert the pose cleanly to PDB with Open Babel first, and never feed a raw PDBQT to LigPlot+.
- PLIP ignores your ligand but reads a crystallographic one. If the file still contains buffer molecules, ions, or waters flagged as HETATM, PLIP may profile the wrong group. Strip everything except your docked ligand before uploading.
Frequently asked questions
Can I make a 2D interaction diagram without installing anything?
Yes. The PLIP web server needs no install and gives you the full interaction list with distances. For a true flat 2D schematic online, PoseView on the ProteinsPlus server is a free web alternative to the desktop LigPlot+.
Is LigPlot+ free?
It is free for academic and non-commercial use after a short registration on the EMBL-EBI Thornton group page. Commercial users need a licence.
Do LigPlot+ and PLIP work on an AutoDock Vina pose directly?
Not on the raw PDBQT. Convert the best pose to PDB with Open Babel and merge it with the receptor into a single PDB first, then both tools read it.
Why do LigPlot+ and PLIP sometimes disagree?
They use different geometric cutoffs and detect different interaction sets. LigPlot+ focuses on hydrogen bonds and hydrophobic contacts, while PLIP also reports pi-stacking, salt bridges, halogen bonds, and more. Report both and note the tool for each interaction.
Which single figure should go in my thesis?
Use the LigPlot+ 2D diagram as the main figure because it is instantly readable, and keep the PLIP table in the supplementary material as the quantitative backup.
Want the guided, hands-on version?
Our live Molecular Modeling & MD Simulations cohort bootcamp takes you from zero to running real docking and MD workflows, with a portfolio project for your grad-school applications.
Sources: Laskowski RA, Swindells MB. LigPlot+: multiple ligand-protein interaction diagrams for drug discovery. J Chem Inf Model. 2011;51(10):2778-2786. doi:10.1021/ci200227u. Salentin S, et al. PLIP: fully automated protein-ligand interaction profiler. Nucleic Acids Res. 2015;43(W1):W443-W447. doi:10.1093/nar/gkv315. Wallace AC, Laskowski RA, Thornton JM. LIGPLOT: a program to generate schematic diagrams of protein-ligand interactions. Protein Eng. 1995;8(2):127-134.