
How to Read a wwPDB Validation Report Before You Dock

A wwPDB validation report grades a PDB entry against the whole archive. Before docking, check that the percentile sliders for Rfree, clashscore, Ramachandran, sidechain and RSRZ outliers sit toward the blue (right) end, that binding-site residues carry no red outlier marks, and that the co-crystal ligand has RSCC above about 0.9 and a low RSR.
Most students choose a PDB entry by resolution alone, download it, and start docking. Resolution tells you how much data the crystallographers had. It does not tell you whether the atoms in your binding site were placed well, or whether the co-crystallised ligand you plan to use for redocking is actually supported by the electron density. Every released X-ray entry comes with a free validation report from the Worldwide Protein Data Bank (wwPDB) that answers exactly those questions. This guide from the StemSkills Lab team (10+ years in structural bioinformatics, drug design and molecular modelling) walks through one real report section by section, shows you how to pull the same numbers with a short Python script, and ends with a checklist for choosing between entries of the same protein.
What is a wwPDB validation report?
The wwPDB validation report is a standardised quality assessment produced during curation of every PDB entry. It is generated by the same pipeline whichever wwPDB site (RCSB PDB, PDBe or PDBj) processed the deposition, and it comes as a short summary PDF, a full PDF, and machine-readable XML and mmCIF files. The pipeline runs MolProbity for geometry and clashes, Mogul for ligand geometry, and electron-density analysis that compares the model with the deposited structure factors.
The design of the reports is described in the primary paper by Gore et al., “Validation of Structures in the Protein Data Bank”, Structure 25:1916-1927 (2017), and every column is explained in the official wwPDB X-ray Validation Report User Guide. Journals take them seriously: the wwPDB notes that eLife, the Journal of Biological Chemistry and the IUCr journals require the report at manuscript submission.
For a docking student the report matters because docking scores inherit every error in the receptor. A misplaced sidechain in the pocket, or a ligand modelled into weak density, will quietly shape your grid box, your redocking RMSD and your conclusions. If you are still at the stage of picking a target, read our guide to choosing a protein target for docking first, then come back here to vet the candidate entries.
Where do you find the validation report for a PDB entry?
There are three routes, all free and without login:
- The RCSB entry page. Open
https://www.rcsb.org/structure/1CBS(replace the ID with yours). The Structure Summary shows the validation slider graphic with links to the full report. If you need a refresher on finding entries, see how to download a protein structure from RCSB PDB. - The archive directory. Every entry has a folder at
https://files.rcsb.org/pub/pdb/validation_reports/<middle two characters>/<id>/. For 1CBS that isvalidation_reports/cb/1cbs/, which holds1cbs_validation.pdf.gz(summary),1cbs_full_validation.pdf.gz(full),1cbs_validation.xml.gzand the slider image. - The wwPDB sample reports. The wwPDB publishes annotated examples, including the full report for 1CBS, which it describes as an entry with better overall quality relative to all X-ray structures.
Use the summary PDF for a first look. Open the full PDF when you need every outlier listed rather than the worst five per category.
Which worked example does this guide use?
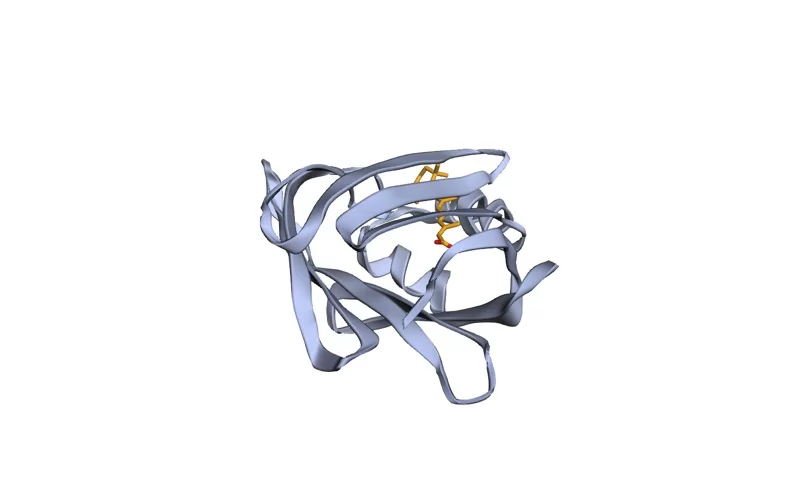
We use PDB 1CBS: human cellular retinoic acid binding protein type II (CRABP II), one chain, with all-trans-retinoic acid bound (ligand code REA, chain A, residue 200). It was deposited in 1994 and solved by X-ray crystallography at 1.80 Å. The wwPDB uses it as its own “good” teaching example, which makes it a safe reference point. Every number quoted below was read from its validation XML (report creation date 10 March 2026), so you can open the same file and check each one.
How do you read the percentile sliders?
The “Overall quality at a glance” section opens with a set of horizontal sliders. Each slider shows a percentile rank, which the user guide defines as “the percentage of entries that are equal or poorer than this structure”. A rank of 90 means the entry beats or ties 90% of the comparison set. Further right (blue) is better; further left (red) is worse.
Each slider carries two markers:
- Black box: rank against all X-ray entries in the archive.
- White box: rank against X-ray entries of similar resolution. The guide states that this bin is the smallest resolution window containing at least 1,000 entries.
The white box is the fairer comparison. A 3.5 Å structure will rarely look good against the whole archive, but it can still be among the best at 3.5 Å. For 1CBS the scale of the comparison is visible in the XML: its clashscore percentile was computed against 190,562 X-ray entries, and its resolution-specific percentile against 8,479 entries.
The five X-ray sliders, and what 1CBS scores on each:
| Slider | What it measures | Better when | 1CBS raw value | 1CBS percentile (all / similar resolution) |
|---|---|---|---|---|
| Rfree | Fit of the model to a small subset of reflections never used in refinement, recalculated by the DCC program | Lower | 0.189 (DCC); depositor reported 0.237 | 89.8 / 92.4 |
| Clashscore | Atom pairs overlapping by 0.4 Å or more, per 1,000 atoms including hydrogens (MolProbity) | Lower | 4.01 | 63.2 / 56.2 |
| Ramachandran outliers | Percentage of residues with unusual phi/psi backbone angles | Lower | 0.00% | 100 / 100 |
| Sidechain outliers | Percentage of residues whose sidechain matches no preferred rotamer | Lower | 1.63% | 54.9 / 47.3 |
| RSRZ outliers | Percentage of residues with real-space R Z-score above 2 (poor fit to density) | Lower | 0.00% | 100 / 100 |
Read it this way: 1CBS has no backbone or density-fit outliers and an Rfree better than about 90% of the archive. Its clashscore and sidechain outliers are middling, roughly at the median for its resolution. That is typical of a carefully refined mid-1990s structure, since the all-atom clash analysis used today did not exist when it was built. Middling sliders are not a reason to reject an entry; they tell you where to look next.
Two definitions from the guide are worth memorising. MolProbity, described in Chen et al., Acta Cryst. D66:12-21 (2010), supplies clashscore, Ramachandran and rotamer checks. RSRZ normalises the real-space R value by residue type and resolution, following the Uppsala Electron-Density Server paper (Kleywegt et al., 2004), and a residue counts as an RSRZ outlier when its value is greater than 2. RSRZ is computed only for standard amino acids and nucleotides, never for ligands.
Want the guided, hands-on version?
Our live Molecular Modeling & MD Simulations cohort bootcamp takes you from zero to running real docking and MD workflows, with a portfolio project for your grad-school applications.
How do you check the binding-site residues?
Global sliders average over the whole chain. Your docking result depends on perhaps 15 to 25 residues. Check those specifically:
- List the pocket residues. In PyMOL,
select pocket, byres (polymer within 4 of resn REA)gives every protein residue with an atom within 4 Å of the ligand. For 1CBS this returns 15 residues, including Arg132 and Tyr134 near the retinoic acid carboxylate. - Find them in the residue-property plot. The report draws each chain as a sequence strip. A red dot above a residue marks an RSRZ outlier; coloured segments mark geometry outliers (green for none, then yellow, orange and red for one, two, or three or more criteria), and grey marks residues present in the sample but absent from the model. The guide’s advice is direct: outliers at “ligand-binding residues” should be inspected extra carefully.
- Cross-check the outlier tables. The full report lists every Ramachandran, rotamer and clash outlier by residue number. In 1CBS the only two sidechain outliers are Met27 and Asp127, and neither is in the 4 Å pocket. Every pocket residue has a negative or near-zero RSRZ (the highest is Val76 at 0.06), so the binding site is well supported by density.
If a pocket residue is a rotamer outlier or an RSRZ outlier, look at it against its electron density before trusting it (the Mol* viewer on the RCSB entry page can load the density for X-ray entries, or download the map coefficients from the same validation folder). An outlier can be a genuine strained conformation that matters for binding, or a modelling error. The report flags; you decide. For residues that are missing altogether, see how to fix missing residues and loops.
How do you judge the co-crystal ligand’s fit with RSCC and RSR?
Ligands get their own table under “Fit of model and data”. Because there are too few instances of most ligands in the archive to compute a Z-score, the report uses two raw measures instead, following Smart et al., “Validation of ligands in macromolecular structures determined by X-ray crystallography”, Acta Cryst. D74:228-236 (2018):
- RSCC (real-space correlation coefficient): how well the density calculated from the ligand model correlates with the experimental density. The user guide says above 0.95 normally indicates a very good fit, around 0.90 is generally acceptable, and around or below 0.80 may mean “the experimental data do not accord with the ligand placement”.
- RSR (real-space R value): 0 is perfect agreement; values approaching or above 0.4 indicate a poor fit or low resolution.
The same table lists atoms modelled versus atoms expected, the ligand’s B-factor spread, and how many atoms have occupancy below 0.9. A ligand with all atoms present, full occupancy, and B-factors similar to the surrounding protein is the one you want as a redocking reference.
For 1CBS, REA chain A residue 200 has RSCC 0.949, RSR 0.043, average occupancy 1.00, and all 22 heavy atoms in the density analysis. That is a ligand you can trust for redocking validation. Mogul flags three torsion outliers on it (including the carboxylate torsions), which is a reminder that a well-placed ligand can still have unusual geometry worth knowing about before you parameterise it.
For contrast, look at the wwPDB’s own “possible ligand issues” example, PDB 1EG1 (Trichoderma reesei endoglucanase I at 3.60 Å). Its N-acetylglucosamine sugars (NAG) score RSCC 0.794, 0.883, 0.716 and 0.674. Three of the four sit at or below the 0.80 warning level. If you were docking a carbohydrate into that site, those numbers would send you looking for a better entry.
Recent reports also include density images for the depositor’s “ligand of interest” and for ligands over 250 Da that have outliers: the 2mFo-DFc map in grey, positive difference density in green, negative in magenta. Green blobs near a ligand suggest something unmodelled; magenta on the ligand suggests atoms placed where there is no density.
Can you get the same numbers with a script?
Yes. When you are comparing ten entries, reading PDFs is slow. The XML holds every value. Download it and run a short Python script that uses only the standard library:
curl -sL https://files.rcsb.org/pub/pdb/validation_reports/cb/1cbs/1cbs_validation.xml.gz | gunzip > 1cbs.xmlimport sys
import xml.etree.ElementTree as ET
root = ET.parse(sys.argv[1]).getroot()
entry = root.find("Entry").attrib
for key in ["PDB-resolution", "DCC_Rfree", "clashscore",
"percent-rama-outliers", "percent-rota-outliers",
"percent-RSRZ-outliers"]:
print(f"{key:24s} {entry.get(key)}")
for res in root.findall("ModelledSubgroup"):
a = res.attrib
if a.get("rscc") and a.get("resname") != "HOH" and "rsrz" not in a:
print(a["resname"], a["chain"], a["resnum"],
"RSCC", a["rscc"], "RSR", a.get("rsr"))Save it as vr_summary.py and run python3 vr_summary.py 1cbs.xml. For 1CBS it prints resolution 1.80, DCC Rfree 0.1887, clashscore 4.01, 0.00% Ramachandran, 1.63% rotamer and 0.00% RSRZ outliers, then REA A 200 RSCC 0.949 RSR 0.043. The percentile ranks live in the same Entry element under keys such as relative-percentile-clashscore. The script skips residues that have an RSRZ value, which leaves ligands and other non-standard groups.
How do you choose between several entries of the same protein?
Popular targets often have dozens of entries. Rank your shortlist in this order:
- Right biology first. Correct species, construct covering your binding site, and a bound ligand of the chemical class you care about. No validation score rescues the wrong conformation.
- Ligand fit. Prefer the entry whose co-crystal ligand has RSCC around 0.9 or higher, a low RSR, complete atoms and full occupancy. This ligand anchors your redocking check.
- Pocket residues. Prefer zero RSRZ, Ramachandran and rotamer outliers within 4 to 5 Å of the ligand, and no missing residues in the pocket.
- Resolution-specific sliders. Among the remaining entries, prefer white-box ranks in the blue for Rfree and RSRZ outliers.
- Resolution as a tie-breaker. Only now does a 1.8 Å entry beat a 2.2 Å one.
Record the chosen entry’s key numbers (resolution, Rfree, clashscore, ligand RSCC) in your methods section. Reviewers increasingly ask why a particular structure was used, and “it had the best validation report among the N entries for this protein” is a defensible answer. Our broader guide to validating a protein structure covers checks you run on your own models, where no wwPDB report exists.
What problems do students hit when reading these reports?
- “The ligand I want is missing from the ligand table.” The ligand table lists only ligands with density analysis. Check the “Entry composition” section; if your ligand is there but has no RSCC, the structure factors may be missing, which happens with some older entries.
- “The Rfree in the report does not match the paper.” The slider uses a recalculation by the DCC program. For 1CBS the depositor reported 0.237 and DCC gives 0.189. Both appear in the “Data and refinement statistics” table. Quote the one you mean and say which.
- “My cryo-EM entry has no RSRZ or RSCC.” Those are X-ray measures. EM reports use different map-model metrics, such as Q-score, and have their own user guide.
- “RSRZ looks fine but the structure is 3.8 Å.” The guide warns that for resolutions worse than 3 Å, and residues with B-factors above 90 Ų, RSR and RSCC values may be unreliable. Treat low-resolution density metrics with caution.
- “There is no LLDF value.” Older reports used LLDF for ligand fit. The wwPDB dropped it because it gave misleading results in some cases; use RSCC and RSR.
- “The PDF will not open.” Files from the archive directory are gzipped. Run
gunzip 1cbs_validation.pdf.gzfirst, or use the link on the entry page.
Once you have picked a well-validated entry, the next steps are covered in our guides to preparing the protein and ligand for docking and the full molecular docking learning path. To see where structure validation fits in the bigger picture, follow the computational biology skills roadmap.
Frequently asked questions
What is a good clashscore in a wwPDB validation report?
Lower is better, and the absolute number depends on resolution, so read the percentile instead. A clashscore in the blue end of the resolution-specific slider is good. 1CBS scores 4.01 clashes per 1,000 atoms, which sits near the median for 1.8 Å structures.
What RSCC value is acceptable for a ligand?
The wwPDB user guide states that RSCC above 0.95 normally indicates a very good fit, around 0.90 is generally acceptable, and around or below 0.80 may mean the data do not support the ligand placement. Pair it with RSR, where values near 0.4 or higher indicate a poor fit.
What does an RSRZ outlier mean?
RSRZ is the real-space R value of a residue, normalised by residue type and resolution. A residue with RSRZ greater than 2 fits its electron density worse than expected and is flagged as an outlier. RSRZ is calculated only for standard amino acids and nucleotides.
What is the difference between the black and white slider markers?
The black box ranks the entry against all X-ray structures in the archive. The white box ranks it against X-ray structures of similar resolution, using the smallest resolution bin that contains at least 1,000 entries. The white box is the fairer comparison.
Do AlphaFold models have wwPDB validation reports?
No. wwPDB validation reports cover experimentally determined structures in the PDB archive. Predicted models carry their own confidence scores, such as pLDDT, and need separate validation with tools like MolProbity.
Want the guided, hands-on version?
Our live Molecular Modeling & MD Simulations cohort bootcamp takes you from zero to running real docking and MD workflows, with a portfolio project for your grad-school applications.